Image Details
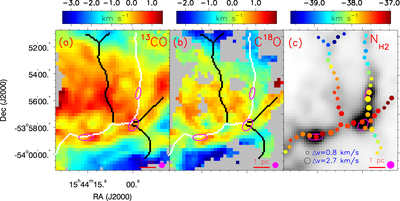
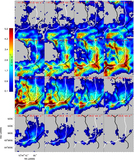
Caption: Figure 5.
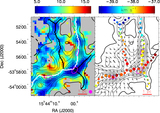
(a) The map illustrates the differences between the first velocity moment (velocity field) of 13CO (J = 2–1) and the systemic velocity of the cloud (V lsr = −37.7 km s−1). The main and branched skeletons are shown as white and black curves, respectively. Magenta ellipses mark the dust clumps. The filled magenta circle in the lower right corner indicates the beam size of the CO observation. (b) Same as the left panel, but for C18O (J = 2–1). (c) Color-coded line-of-sight velocity centroids of C18O (J = 2–1) extracted along filaments overlaid on top of an H2 column density map. The sizes of the symbols indicate the line width of C18O (J = 2–1). The filled magenta circle in the lower right corner indicates the beam size of the Herschel 500 μm wave band.
Other Images in This Article
Show More
Copyright and Terms & Conditions
© 2023. The Author(s). Published by the American Astronomical Society.