Image Details
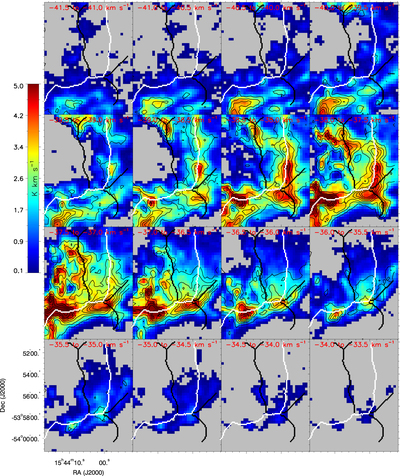
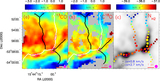
Caption: Figure 4.
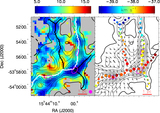
Channel maps of the 13CO (J = 2–1) and C18O (J = 2–1) lines, showing a 13CO (J = 2–1) integrated intensity map (start from 6σ) with C18O (J = 2–1) integrated intensity overlaid as contours. The contours start from 6σ to the peak value with steps of 8σ. The σ of the integrated intensity for both CO isotopologues in the interval velocity range of 0.5 is 0.018 K km s−1. This value is calculated as ﹩{T}_{\mathrm{rms}}\times \sqrt{{N}_{\mathrm{channels}}}\times \delta V﹩, where T rms = 0.08 K represents the typical rms value of the molecular line observations, N channels = 5 denotes the total number of line channels, and δ V = 0.1 km s−1 stands for the velocity resolution. The main and branched skeletons are shown as white and black curves, respectively.
Other Images in This Article
Show More
Copyright and Terms & Conditions
© 2023. The Author(s). Published by the American Astronomical Society.