Image Details
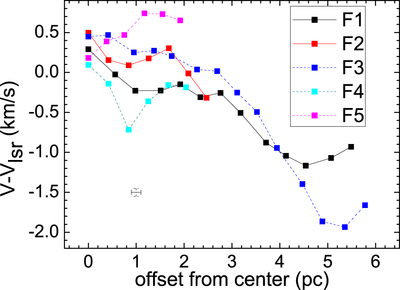
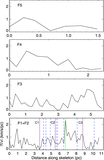
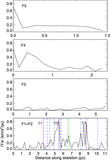
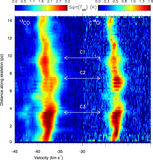
Caption: Figure 6.
The line-of-sight velocity profile of the gas within each filament is plotted as a function of position from the center of the filament. The positions are as follows: position C2 for F1 (black solid line), F4 (cyan dotted line), and F5 (magenta dotted line); position at the junction between F3 and the major branch of filaments for F3 (blue dotted line); and position C3 for F2 (red solid line).
Other Images in This Article
Show More
Copyright and Terms & Conditions
© 2023. The Author(s). Published by the American Astronomical Society.
Copyright ©
2026 Astronomy Image Explorer. All Rights Reserved.