Image Details
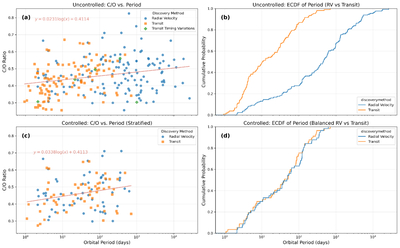
Caption: Figure 8.
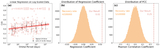
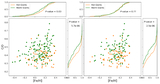
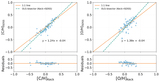
Comparison of C/O–period trends in transit and RV samples: uncontrolled vs. controlled (stratified). Top row: uncontrolled sample of giant planets. (a) C/O ratio vs. orbital period for all discovery methods, with a linear regression fit shown in pink. (b) CDFs of orbital periods for transit and RV planets, highlighting differences in period sampling. Bottom row: controlled sample with stratified period-matched subsampling between RV and transit samples. (c) Regression between C/O ratio and orbital period using the balanced sample. (d) Corresponding CDFs confirm similar period distributions in the controlled case. Regression lines are shown with their equations annotated in pink. All regression fits are performed in log-period space.
Other Images in This Article
Show More
Copyright and Terms & Conditions
© 2026. The Author(s). Published by the American Astronomical Society.