Image Details
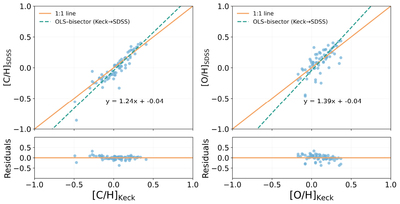
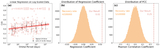
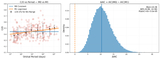
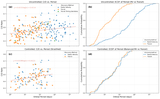
Caption: Figure 10.
Cross calibration of [C/H] and [O/H] between the KECK and SDSS samples. Top: comparison of abundances between the two surveys. The orange solid line indicates the 1:1 relation, while the teal dashed line represents the best-fit OLS-bisector calibration. Bottom: residuals relative to the best-fit line.
Other Images in This Article
Show More
Copyright and Terms & Conditions
© 2026. The Author(s). Published by the American Astronomical Society.
Copyright ©
2026 Astronomy Image Explorer. All Rights Reserved.