Image Details
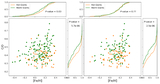
Caption: Figure 1.
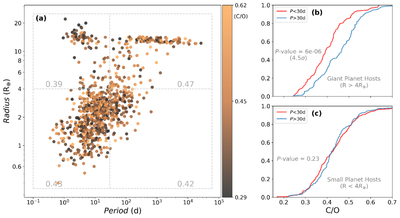
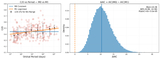
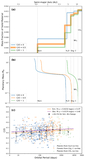
Period–radius and C/O ratio distribution in hosts with different types of planets. Panel (a) is the period–radius diagram of planets, with the C/O ratio of their host stars color coded. The dashed lines (P = 30 days, Radius = 4R⊕) divide the figure into four parts; the top two parts are hot/cold giant planets, while the bottom panels are hot/cold small planets. The gray numbers in each part indicate the median C/O ratio of the respective regions. Panel (b) compares the cumulative distributions of the C/O ratios for stars hosting giant planets with short (<30 days) and long (>30 days) orbital periods and radii Rp > 4R⊕. Panel (c) is analogous to panel (b), but it focuses on small planets with Rp < 4R⊕.
Other Images in This Article
Show More
Copyright and Terms & Conditions
© 2026. The Author(s). Published by the American Astronomical Society.