Image Details
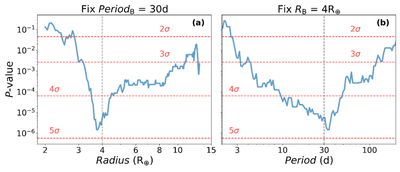
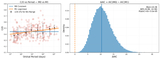
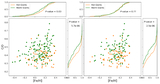
Caption: Figure 2.
P-values from K-S tests comparing C/O distributions of exoplanet hosts across radius (a) and period (b) selection. This figure shows the P-values from K-S tests, which assess whether the C/O distributions of short-period and long-period exoplanets are drawn from the same parent population. Panel (a) shows the P-value as a function of the chosen radius boundary for selecting giant planets, with the orbital period boundary fixed at 30 days. The vertical dashed line marks the fiducial radius boundary at RB = 4R⊕. Panel (b) shows the P-value as a function of the chosen period boundary for separating short/long-period giant planets, while fixing the radius boundary at RB = 4R⊕. The vertical dashed line marks the fiducial period boundary at 30 days.
Other Images in This Article
Show More
Copyright and Terms & Conditions
© 2026. The Author(s). Published by the American Astronomical Society.