Image Details
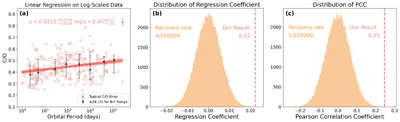
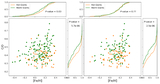
Caption: Figure 4.
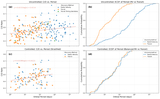
Positive correlation between giant-planet orbital periods and stellar C/O ratios. Panel (a) shows the result of a linear regression on log-scaled orbital period data, revealing a positive slope in C/O with increasing period. Panels (b) and (c) display the distributions of regression coefficients and PCC, respectively, from 100,000 random permutations of the data. The vertical dashed lines indicate the observed values.
Other Images in This Article
Show More
Copyright and Terms & Conditions
© 2026. The Author(s). Published by the American Astronomical Society.
Copyright ©
2026 Astronomy Image Explorer. All Rights Reserved.