Image Details

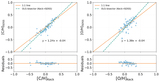
Caption: Figure 5.
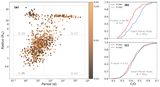
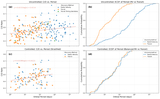
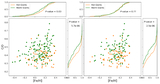
C/O ratio vs. orbital period and model comparison. Left: Monte Carlo–averaged fits comparing two models for the planetary C/O ratio as a function of the orbital period: a constant model (M0; blue) and a log-linear model (M1; orange). Each curve shows the median fit with shaded ±1σ bands across 105 trials, and the black points mark the median and ±34.1% range within logarithmic period bins. Right: distribution of ΔAIC = AIC(M0) − AIC(M1) from 105 Monte Carlo realizations, with the median (blue) and the null reference line at ΔAIC = 0 (orange dashed). Positive ΔAIC values indicate that the log-linear model provides a statistically better description of the data than the constant model.
Other Images in This Article
Show More
Copyright and Terms & Conditions
© 2026. The Author(s). Published by the American Astronomical Society.