Image Details
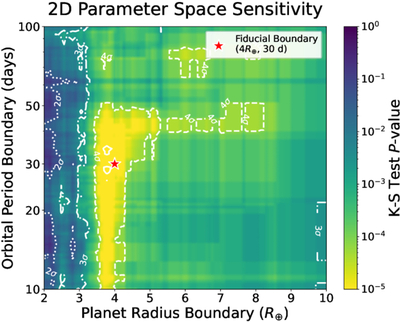
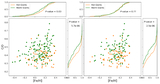
Caption: Figure 3.
Two-dimensional parameter space sensitivity of the K-S test. The color scale shows the K-S test P-value comparing the C/O distributions of short- and long-period giant-planet hosts as both the planet radius boundary (x-axis) and the orbital period boundary (y-axis) are varied simultaneously. White contours mark the 2σ, 3σ, and 4σ significance levels. The red star indicates the fiducial boundary (4 R⊕, 30 days). The region of high statistical significance is broad and contiguous, spanning RB ≈ 3–5 R⊕ and PB ≈ 10–45 days, with a sharper peak along the radius axis than the period axis.
Other Images in This Article
Show More
Copyright and Terms & Conditions
© 2026. The Author(s). Published by the American Astronomical Society.
Copyright ©
2026 Astronomy Image Explorer. All Rights Reserved.