Image Details
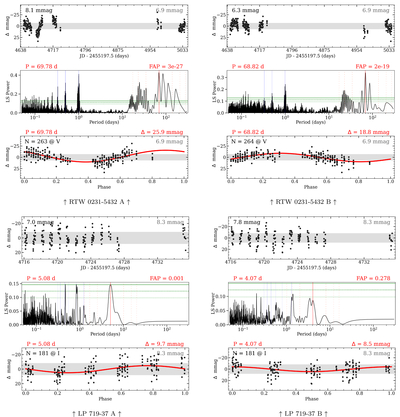
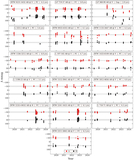
Caption: Figure 10.
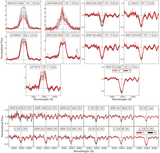
Rotation period results for the six New Systems with values in Table 6 using data from the CTIO/SMARTS 0.9 m. Each vertical trio of panels assesses the data for a single star in a twin pair. The top panel is a differential light curve in a format similar to Figure 8, with times relative to 2010.0 (JD 2455197.5). Black numbers in the top left of this panel indicate the MAD from the mean for the filled points, while gray numbers in the top right are the average MAD of the nonvarying reference stars. These light-curve data are available as Data behind the Figure (DbF) products. The middle panel shows a Lomb–Scargle periodogram of the data above, with horizontal green lines at false-alarm probability (FAP) values of 10% (dotted)/1% (dashed)/0.1% (solid), a vertical red line at the selected periodogram peak, vertical dashed orange lines at the 2/3/4 harmonic multiples, and vertical purple lines at the n = [−3,…, 3] 1 day sampling aliases. The bottom panel shows the corresponding phase-folded light curve based on the rotation period and the epoch of the first point, with the Lomb–Scargle sine wave, rotation period, FAP, and peak-to-peak amplitude (Δ) all shown and given in red. The number of filled points (N) and observing filter are given in the top left of this panel; open points correspond to visits with only one usable frame. Our final adopted rotation periods are often supported by multiple results beyond just these, as discussed in Section 8.
(The data used to create this figure are available in the online article.)
(The data used to create this figure are available.)
Other Images in This Article
Show More
Copyright and Terms & Conditions
© 2026. The Author(s). Published by the American Astronomical Society.