Image Details
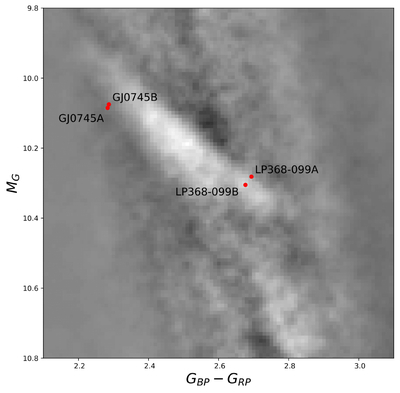
Caption: Figure 18.
A visually enhanced plot of the Gaia main sequence from W.-C. Jao & G. A. Feiden (2020) showing the M dwarf PC/FC transition gap, in which white indicates fewer stars. LP 368–99 A (Prot = 1.19 days) and B (Prot = 2.53 days) are plotted highlighting their relative positions on the upper edge of the gap and directly within the gap, respectively. Stars in the gap region undergo complex interior structure changes, which we hypothesize might be why the two components have rotation periods differing by roughly a factor of 2 (see Section 11.5 for further details). GJ 745 A and B are also shown to demonstrate their positions either within the gap or just below the gap, as discussed in Section 11.8.
Other Images in This Article
Show More
Copyright and Terms & Conditions
© 2026. The Author(s). Published by the American Astronomical Society.