Image Details
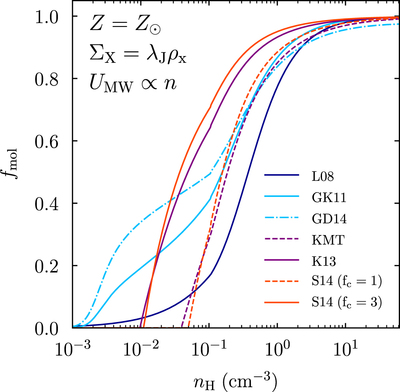
Caption: Figure 13.
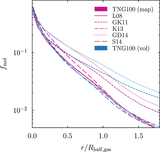
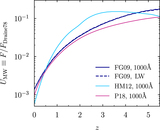
Molecular fraction as a function of density as predicted by the H I/﹩{{\rm{H}}}_{2}﹩ models used in this paper. This calculation depends on a number of variables that are computed similarly to the blue lines in Figure 1: we choose solar metallicity, T = 10,000 K below the star formation threshold, the SH03 model’s equation of state above the star formation threshold, and the ﹩{U}_{\mathrm{MW}}\approx 10\ {n}_{{\rm{H}}}/(1{\mathrm{cm}}^{-3})﹩ relation shown in Figure 1. In reality, these conditions vary across our galaxy sample. This figure corresponds to the volumetric implementation of the models in that we estimate surface densities from the density on the x axis and the Jeans length. The dark blue line shows the prediction of the volumetric L08 model, which we have shown to be unphysical (Section 2.5.1). The light blue lines show that the GK11 and GD14 models agree well and that they predict nonzero molecular fractions out to lower densities than other models. The dashed lines show the original KMT and S14 models, which agree well. The K13 model predicts higher molecular fractions at low density due to the addition of the hydrostatic pressure floor (Appendix C.4). Applying a clumping factor of fc = 3 to the S14 model brings it into close agreement with K13 (Appendix C.5).
Other Images in This Article

Show More
Copyright and Terms & Conditions
© 2018. The American Astronomical Society. All rights reserved.