Image Details
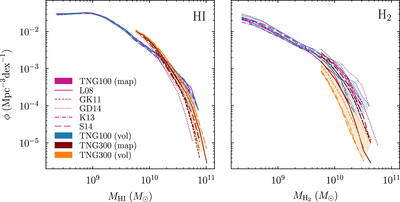
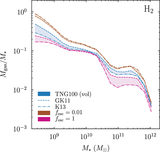
Caption: Figure 6.
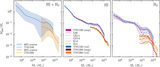
Mass functions of H I (left) and ﹩{{\rm{H}}}_{2}﹩ (right). The lines and shaded regions have the same meaning as in Figure 5. The different H I/﹩{{\rm{H}}}_{2}﹩ models agree very well with each other, with the exception that the volumetric versions predict a lower ﹩{{\rm{H}}}_{2}﹩ mass function in TNG300. Generally, the agreement between TNG100 and TNG300 appears to be better than in the gas mass fractions. As in Figure 5, the gas masses contain all cells bound to a galaxy and should thus not be compared to observations.
Other Images in This Article

Show More
Copyright and Terms & Conditions
© 2018. The American Astronomical Society. All rights reserved.
Copyright ©
2026 Astronomy Image Explorer. All Rights Reserved.