Image Details
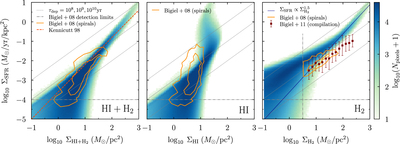
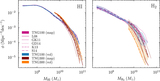
Caption: Figure 3.
Kennicutt–Schmidt relation for neutral (left), atomic (center), and molecular (right) gas. The histograms show the distribution of pixels from the projected maps of TNG100 galaxies. In each panel, the dotted lines correspond to constant depletion times of ﹩{\tau }_{\mathrm{dep}}={{\rm{\Sigma }}}_{\mathrm{gas}}/{{\rm{\Sigma }}}_{\mathrm{SFR}}﹩. The orange contours roughly indicate the location of the spatially resolved observations of seven spiral galaxies of Bigiel et al. (2008), and the horizontal and vertical dot-dashed lines mark their sensitivity limits for star formation and ﹩{{\rm{H}}}_{2}﹩ surface density. Left panel: The total gas KS relation in IllustrisTNG is independent of the H I/﹩{{\rm{H}}}_{2}﹩ models and roughly follows the Kennicutt (1998) relation (red dashed line) at high densities, largely by construction. Around a surface density of ﹩1\ \,{M}_{\odot }\,{\mathrm{pc}}^{-2}﹩, the relation steepens and falls below the Kennicutt (1998) relation, in agreement with observations. Center panel: the distribution of ﹩{{\rm{\Sigma }}}_{{\rm{H}}{\rm{I}}}﹩ according to the projected GD14 model. The other models give very similar trends. The relation between ﹩{{\rm{\Sigma }}}_{{\rm{H}}{\rm{I}}}﹩ and ﹩{{\rm{\Sigma }}}_{\mathrm{SFR}}﹩ is less pronounced than for ﹩{{\rm{\Sigma }}}_{{\rm{H}}{\rm{I}}+{{\rm{H}}}_{2}}﹩ and ﹩{{\rm{\Sigma }}}_{{{\rm{H}}}_{2}}﹩, in agreement with Bigiel et al. (2008). Right panel: The molecular KS relation is not quite obeyed by the simulation. The Bigiel et al. (2008, 2011) data exhibit a roughly constant depletion time, whereas the simulation results are better described by a superlinear relation with a slope of 1.5 (dark blue line). See Section 3.1 for a detailed discussion.
Other Images in This Article

Show More
Copyright and Terms & Conditions
© 2018. The American Astronomical Society. All rights reserved.