Image Details
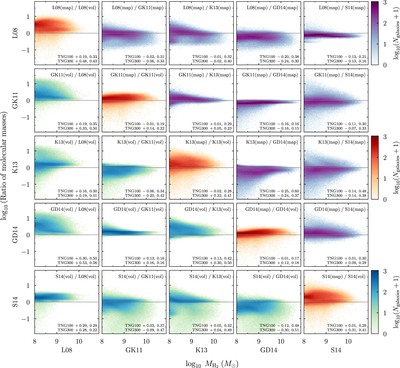
Caption: Figure 4.
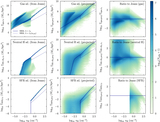
Galaxy-by-galaxy comparison of the ﹩{{\rm{H}}}_{2}﹩ masses predicted by the models studied in this paper. Each panel shows a histogram of TNG100 and TNG300 galaxies, with equal weight on each of the two simulations. The bottom left (blue) panels compare the ﹩{{\rm{H}}}_{2}﹩ masses predicted by the volumetric versions of the models, the top right (purple) panels the projection-based versions, and the diagonal (red) panels compare the volumetric and projection results for each model. The numbers at the bottom right of each panel give the median offset in dex as well as the difference between the 84th and 16th percentiles (i.e., the 68% scatter in dex). Those numbers are given for TNG100 and TNG300 separately and refer only to the galaxies above the threshold of ﹩{M}_{{{\rm{H}}}_{2}}\gt {10}^{8}\,{M}_{\odot }﹩ according to the model plotted on the x axis. The volumetric and projection-based models tend to give similar predictions on average (especially in TNG100) but exhibit significant galaxy-to-galaxy scatter, about 0.2–0.4 dex. The exception is the L08 model (left column), where the projection-based model predicts systematically more ﹩{{\rm{H}}}_{2}﹩ because the volumetric version is not physical (Section 2.5.1). See Section 3.2 for a detailed discussion.
Other Images in This Article

Show More
Copyright and Terms & Conditions
© 2018. The American Astronomical Society. All rights reserved.