Image Details
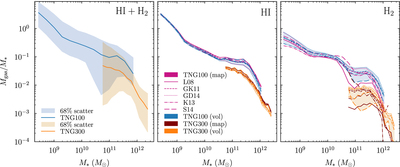
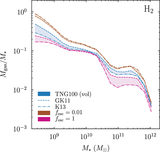
Caption: Figure 5.
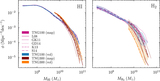
Gas-to-stellar mass ratio for neutral (left), atomic (center), and molecular gas (right). The total neutral gas fraction is shown as a median (solid lines) and 68% scatter (shaded areas). The gas fraction is a factor of two to three lower in TNG300 at fixed stellar mass, indicating that this quantity is not converged with mass resolution. In the center and right panels, the blue and orange lines show the median predictions of the volumetric versions of the H I/﹩{{\rm{H}}}_{2}﹩ models, and the pink and brown lines show the projected versions. The area between the volumetric models is shaded to indicate the range of their predictions (the shading does not indicate scatter). For TNG100, the molecular masses agree to about 0.4 dex in most mass bins, with differences up to 1 dex. The agreement is worse in TNG300, with a typical spread of 0.8 dex. Because molecular gas is subdominant at z = 0, these differences translate into smaller spreads in the H I mass, typically 0.1 dex in TNG100 and 0.15 dex in TNG300, with a maximum of 0.3 dex. The gas fractions include all gas and stellar mass bound to the galaxy and are thus not suitable for comparisons to observations that correspond to a particular aperture or sensitivity limit.
Other Images in This Article

Show More
Copyright and Terms & Conditions
© 2018. The American Astronomical Society. All rights reserved.