Image Details
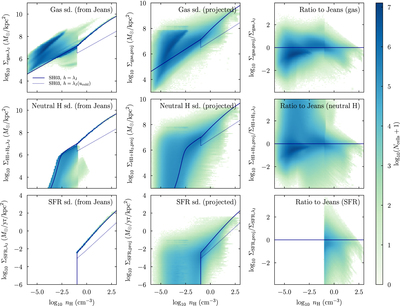
Caption: Figure 8.
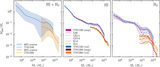
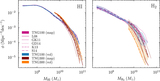
Test of the Jeans approximation by comparing it to projected surface densities. The histograms in each panel show the distribution of particles in TNG100 (see Figure 1). The left column shows the surface densities estimated from the Jeans approximation (﹩{{\rm{\Sigma }}}_{X}={\lambda }_{{\rm{J}}}{\rho }_{X}﹩) for each gas cell, the center column shows the corresponding face-on projected surface density at the 2D position of each gas cell, and the right column shows the ratio between the two surface densities. The three rows refer to total gas density, neutral gas density, and the density of star formation. As in Figure 1, the blue lines show a calculation based on the SH03 equation of state, and the dotted lines show a version that uses the Jeans length of cold gas. The Jeans approximation leads to both a bias in the average surface density of gas as well as large cell-to-cell scatter. The approximation gets worse for the neutral and SFR surface densities.
Other Images in This Article

Show More
Copyright and Terms & Conditions
© 2018. The American Astronomical Society. All rights reserved.