Image Details
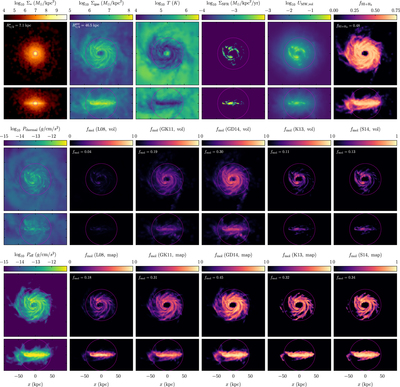
Caption: Figure 2.
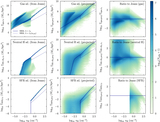
Projections of physical properties and the resulting molecular fractions for a gas-rich disk galaxy in TNG100. At z = 0, this galaxy has a halo mass of ﹩{M}_{200{\rm{c}}}={10}^{12}\,{M}_{\odot }﹩, a total gas mass of ﹩{10}^{11}\,{M}_{\odot }﹩, a stellar mass of ﹩4\times {10}^{10}\,{M}_{\odot }﹩, an SFR of ﹩1.4\,{M}_{\odot }\,{\mathrm{yr}}^{-1}﹩, and a relatively uniform of metallicity of ﹩1.2\ {Z}_{\odot }﹩ on average, and it hosts a black hole of about ﹩{10}^{8}\,{M}_{\odot }﹩. The purple circles indicate the stellar and gas half-mass radii. Each set of panels shows the face-on (perpendicular to the rotation axis) and edge-on projections using all stellar population particles or gas cells that are gravitationally bound to the galaxy. The maps of temperature, thermal pressure, UV field strength, and neutral fraction are weighted by total gas mass, and the maps of molecular fractions by the neutral hydrogen mass. Top row: The UV field strength ﹩{U}_{\mathrm{MW}}﹩ is sourced from star-forming regions and propagated into the surrounding regions (Section 2.4). The neutral fraction refers to the total gas density and thus cannot exceed the primordial hydrogen fraction, 0.76. Middle row: predictions for the molecular fraction according to the volumetric version of the H I/﹩{{\rm{H}}}_{2}﹩ models. The white labels list the overall molecular fractions of the galaxy. Bottom row: same as the middle row, but for the projection-based version of the H I/﹩{{\rm{H}}}_{2}﹩ models. With the exception of the volumetric L08 model, the H I/﹩{{\rm{H}}}_{2}﹩ models vary in their predictions between 11% and 45% molecular fraction, a typical spread for individual galaxies (Section 3.2). The large difference between the volumetric and projected versions of the L08 model is clearly caused by the underlying estimates of the pressure: the thermal pressure (middle left panel) is a poor approximation to the midplane pressure (bottom left panel) that the model should be based on (Equation (6)). The volume-weighted thermal pressure would be even lower than the mass-weighted pressure shown here.
Other Images in This Article

Show More
Copyright and Terms & Conditions
© 2018. The American Astronomical Society. All rights reserved.