Image Details
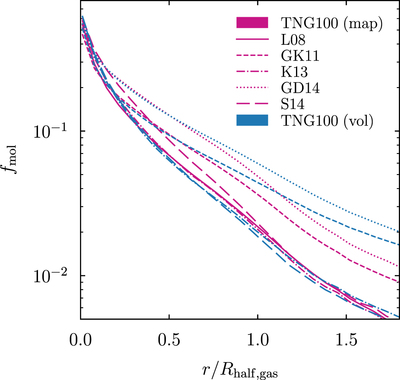
Caption: Figure 7.
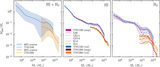
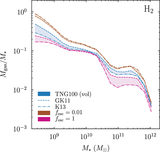
Projected mean radial profiles of the molecular fraction for TNG100 galaxies with ﹩{M}_{{{\rm{H}}}_{2}}\gt {10}^{8}\,{M}_{\odot }﹩. The line styles and colors have the same meaning as in Figures 5 and 6. The GK11 and GD14 models (short-dashed and dotted lines) predict higher molecular fractions at large radii than the other models because they allow for more molecular gas at low densities (Appendix C). While the mean profiles are dominated by low-mass galaxies, the profiles for higher-mass samples lead to the same qualitative conclusions. The corresponding median profiles fall to zero between 0.3 and 1.5 half-mass radii.
Other Images in This Article

Show More
Copyright and Terms & Conditions
© 2018. The American Astronomical Society. All rights reserved.