Image Details
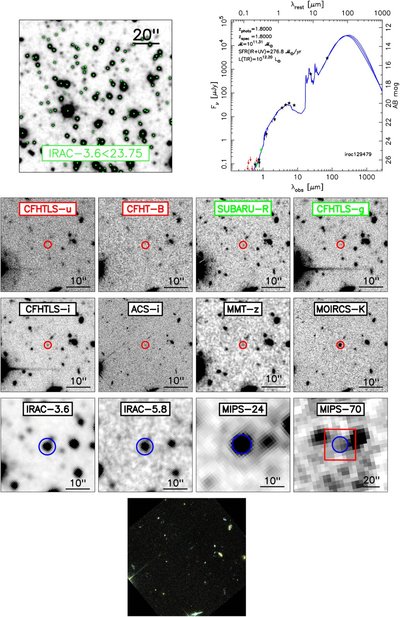
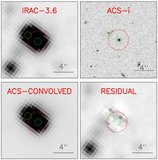
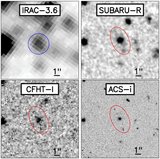
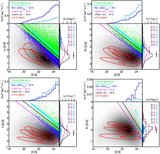
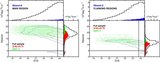
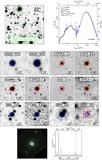
Caption: Figure 11.
Same as Figure 9 for irac129479, an IR-bright galaxy at z = 1.8. This galaxy corresponds to source EGS11 in the paper of Huang et al. (2009). Band labels in red in the gray-scale postage stamps indicate non-detections. For each of these bands, σ sky is depicted in the UV-to-FIR SED as red arrow. Band labels in green indicate forced photometric measurements (see Section 4.2). These bands are shown as green stars in the SED plot.
Other Images in This Article
Show More
Copyright and Terms & Conditions
© 2011. The American Astronomical Society. All rights reserved.
Copyright ©
2026 Astronomy Image Explorer. All Rights Reserved.