Image Details
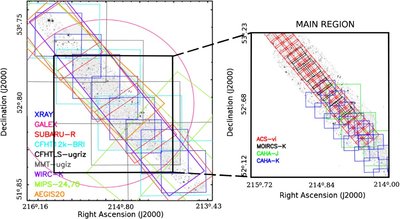
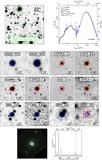
Caption: Figure 1.
Layout of all the imaging surveys covering the EGS. The background gray-scale image shows the IRAC 3.6 μm mosaic. The black square depicts the CFHTLS pointing. The intersection of both footprints defines the region of higher photometric coverage (magnified on the right panel), which is referred as "main region" throughout the text (see Section 5) and contains the highest resolution HST data. The cyan and red rectangles show the CFHT12k- BRI and SUBARU R-band coverage, respectively. The gray and purple squares show the MMT- u′ giz and Chandra/ACIS pointings, respectively. The magenta circle shows the GALEX survey footprint. The green rectangles show the Spitzer/MIPS coverage. The orange rectangle shows VLA 20 cm coverage. In the main region, magnified on the right side of the figure, the red tiles depict the HST/ACS footprints (the NICMOS images overlap with this area). Black rectangles show the MOIRCS K s -band imaging, and the green and purple lines delimit the CAHA J- and K s -band surveys.
Other Images in This Article
Show More
Copyright and Terms & Conditions
© 2011. The American Astronomical Society. All rights reserved.