Image Details
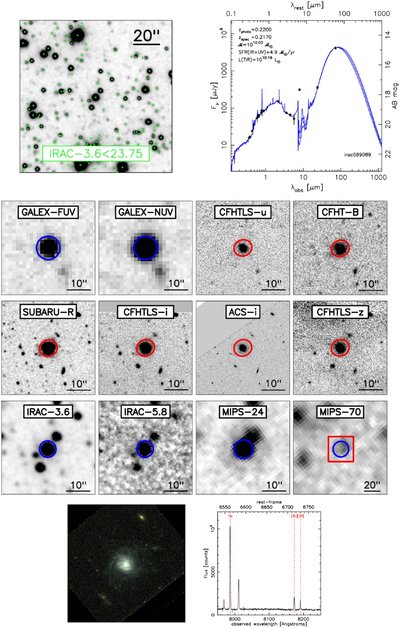
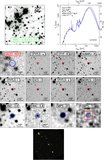
Caption: Figure 9.
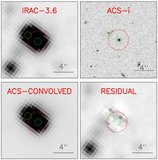
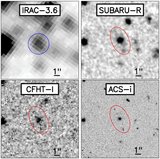
Example of the results available for each IRAC source in the Rainbow database, accessible through the Rainbow Navigator interface. This source is irac089089, a galaxy at z = 0.2170. Top left: map (2′ × 2′) of the sky area around the source. The green dots in the map depict sources in our IRAC catalog with [3.6] < 23.75. By clicking on any of the sources, the interface presents an individual Web site with all the available information for that source. Top right: full UV-to-FIR SED of the central galaxy in the sky map, a source at z = 0.21. The UV-to-NIR data are fitted to a stellar population model, while the IR-part of the SED is fitted to the models of CE01, DH02. A summary of the estimated stellar parameters, such us the stellar mass or the global SFR, is shown in the upper-left corner of the figure. Middle panels: gray-scale postage stamps (with size 40'' × 40'', except for the MIPS 70 image, whose size is 2′ × 2′, same as the map in the top left figure) of the galaxy in some of the available bands, covering different wavelength ranges. The Kron aperture used to measure consistent photometry in optical/NIR bands and the circular aperture used in bands with significantly lower resolution are shown in all panels (red and blue, respectively). Bottom left: RGB color stamp obtained by combining images in the ACS- V 606, i 814 bands. The Rainbow Navigator Web interface allows to produce on-the-fly monochromatic and RGB images changing the cuts interactively. Bottom right: DEEP2 1-D spectra of the galaxy depicting some of the identified lines. The wavelength range and the redshift can be modified interactively.
Other Images in This Article
Show More
Copyright and Terms & Conditions
© 2011. The American Astronomical Society. All rights reserved.