Image Details
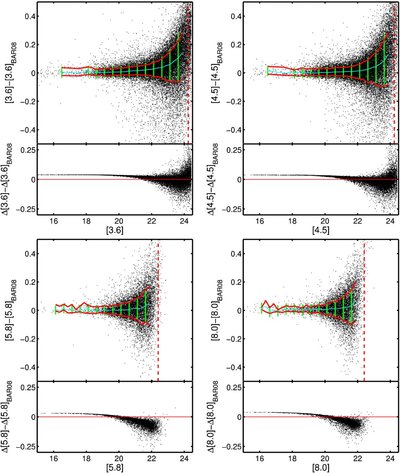
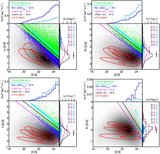
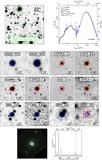
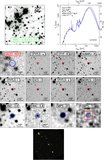
Caption: Figure 3.
Comparison of the observed magnitudes (upper panels) and the photometric errors (lower panels) in the four IRAC bands for the sources in common between our IRAC 3.6+4.5 μm catalog and BAR08 catalog. The cyan line shows the median value of the magnitude difference as a function of magnitude. We have corrected the comparisons by a constant value of −0.05 mag in [3.6] and [4.5] and by −0.04 mag and −0.03 mag in [5.8] and [8.0], respectively. Such small offsets can be attributed to slight differences in the data reduction and aperture corrections. The green bars indicate the average photometric errors per magnitude bin in our catalog. The red lines enclose 1σ of the distribution centered in the median value (cyan line). The vertical dashed line indicate the 5σ limiting magnitude in our catalog. The photometry in the four bands is consistent up to the ~85% completeness limit. The uncertainties in BAR08 are 5% to 10% larger at faint magnitudes, probably as a result of the slightly different procedure applied to measure the sky background.
Other Images in This Article
Show More
Copyright and Terms & Conditions
© 2011. The American Astronomical Society. All rights reserved.