Image Details
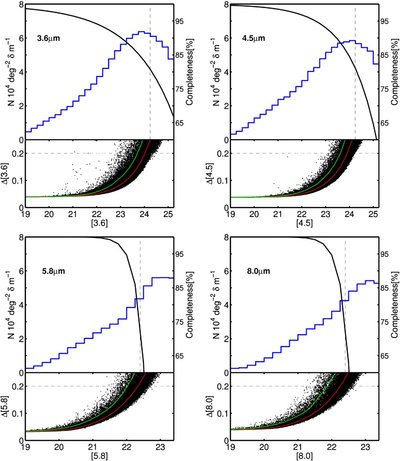
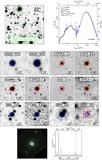
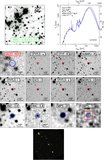
Caption: Figure 2.
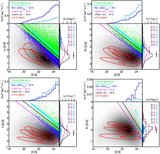
Upper panel of each quadrant shows the histogram of IRAC magnitudes for the sources in our sample selected in the IRAC 3.6 μm+4.5 μm data. The histograms are shown up to the 2σ limiting magnitude in each band. The blacks continuous curve depicts the detection efficiency as estimated from recovery rate of simulated punctual sources. The vertical dashed lines represent five times the median sky rms (5σ) measured in a large number of 2'' radius apertures. The lower panels in each quadrant show the distribution of photometric uncertainties as a function of the magnitude in each IRAC band. The red and green lines indicate the median and 90% of the error distribution as a function of magnitude, respectively. The horizontal dashed line shows the S/N ~ 5 limit; the intersection with the red line indicates the values quoted in Table 1 for the IRAC bands. Note that these values are slightly lower than the 5σ sky rms.
Other Images in This Article
Show More
Copyright and Terms & Conditions
© 2011. The American Astronomical Society. All rights reserved.