Image Details
Caption: Figure 4.
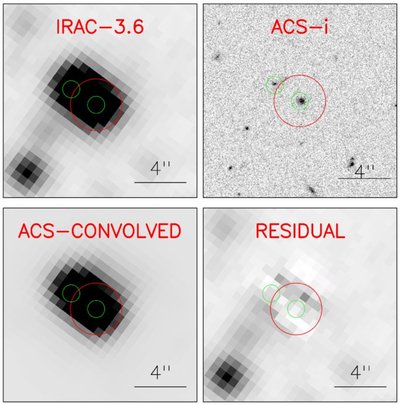
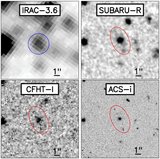
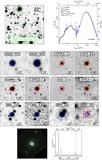
Example of the deconvolution procedure for unresolved sources in IRAC images. After the deblending, the unique IRAC source
(irac164074) becomes two separate sources (irac164074 _1 and _2). Top left (a): IRAC 3.6 μm image (0
![]() 61 pixel
−1) showing a blended source. The red circle depicts a 2'' radius aperture (our default aperture for isolated sources). The
green circles show 0
61 pixel
−1) showing a blended source. The red circle depicts a 2'' radius aperture (our default aperture for isolated sources). The
green circles show 0
![]() 9 apertures centered at the positions of sources in the reference image. Top right (b):
HST/ACS reference image (0
9 apertures centered at the positions of sources in the reference image. Top right (b):
HST/ACS reference image (0
![]() 02 pixel
−1) after applying a 4′ × 4′ local WCS re-alignment, showing the individual sources. Bottom left (c): model of the blended source
obtained by convolving the PSF of
HST/ACS to the PSF of IRAC 3.6 μm in (b), registering it to image (a) and scaling each source to the flux in the 0
02 pixel
−1) after applying a 4′ × 4′ local WCS re-alignment, showing the individual sources. Bottom left (c): model of the blended source
obtained by convolving the PSF of
HST/ACS to the PSF of IRAC 3.6 μm in (b), registering it to image (a) and scaling each source to the flux in the 0
![]() 9 apertures (green) in (a). Bottom right (d): residual from the subtraction of the model and science images (c–a).
9 apertures (green) in (a). Bottom right (d): residual from the subtraction of the model and science images (c–a).
Other Images in This Article
Show More
Copyright and Terms & Conditions
© 2011. The American Astronomical Society. All rights reserved.