Image Details
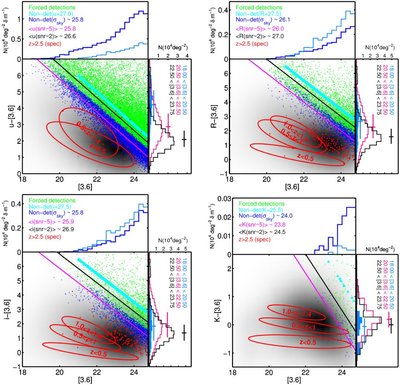
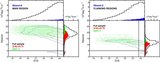
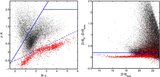
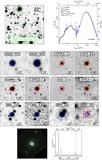
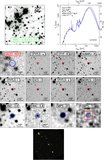
Caption: Figure 6.
Central panel in each plot shows the color magnitude diagrams in the u*, R, i′, and K bands with respect to [3.6] (top to bottom, left to right). The density map in gray scale shows the distribution of IRAC sources detected in each band. For sources missing (not detected by SExtractor) in a given band but detected in any other, we force a flux measurement at the position of the existing source using the same Kron aperture. The green dots depict sources for which we are able to recover a positive flux in this forced measurement. The blue dots depict the value of the sky rms in the apertures where the forced measurement failed (i.e., the integrated flux was negative). The cyan triangles are sources undetected in any other band but IRAC. For these sources, we set an upper limiting magnitude ~0.5–1 mag fainter than the typical magnitude for a source with S/N = 2 (black line). The magenta solid line indicates the median magnitude of the sources with S/N ~ 5. The red dots depict galaxies with spectroscopic redshift z>2.5. The red ellipses show the median and quartiles of the color–magnitude distribution for galaxies in different bins of redshift within 0 < z < 1.5. The upper panel of each quadrant shows the [3.6] brightness distribution of undetected sources (blue and cyan markers in the central panel) in each band. The right panel of each quadrant shows the color distribution of detected sources (histogram, median, and quartiles) in three bins of the [3.6] magnitude.
Other Images in This Article
Show More
Copyright and Terms & Conditions
© 2011. The American Astronomical Society. All rights reserved.