Image Details
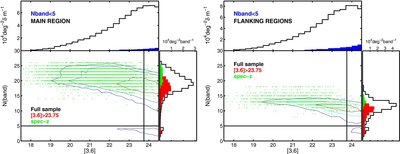
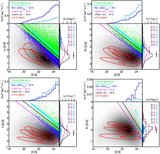
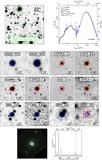
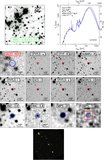
Caption: Figure 7.
Central panel in each plot depicts the source density as function of the number of bands in which the source was detected (a positive flux was measured), N(band), and the magnitude in the [3.6] channel, for the main region (left) and the flanking regions (right). The color contours contain (from the inside out) approximately 25%, 50%, 75%, and 90% of the sources. The green dots mark galaxies with a spectroscopic redshift. The black lines indicate the 85% completeness limit of the catalog ([3.6] < 23.75, vertical) and the band coverage limit N(band) = 5 (horizontal), respectively. The histograms on top show the brightness distribution for the full sample (black) and for sources with N(band) < 5 (blue). The histograms to the right show the N(band) distribution of the full sample (black line), IRAC faint sources ([3.6] > 23.75; red area) and galaxies with spectroscopic redshifts (green area).
Other Images in This Article
Show More
Copyright and Terms & Conditions
© 2011. The American Astronomical Society. All rights reserved.