Image Details
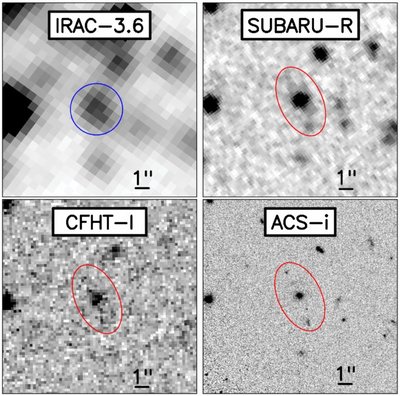
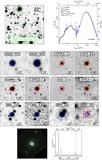
Caption: Figure 5.
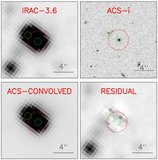
Multi-band images of an IRAC-selected source (irac096525) in the [3.6],
R,
I, and
i
814 bands (from left to right and top to bottom). The size of the frames is 15'' ×15''. In the three optical bands, the flux
is measured in elliptical apertures (red) whose parameters are determined in the
R-band image. Note that, despite the different image resolutions (and multiple
HST counterparts), the accurate WCS re-centering (rms < 0
![]() 15) allows to place the aperture correctly, recovering the flux of all sources. For the IRAC bands, we use fixed circular
apertures of 2'' radius (blue) and we apply a correction to the total magnitude.
15) allows to place the aperture correctly, recovering the flux of all sources. For the IRAC bands, we use fixed circular
apertures of 2'' radius (blue) and we apply a correction to the total magnitude.
Other Images in This Article
Show More
Copyright and Terms & Conditions
© 2011. The American Astronomical Society. All rights reserved.