Image Details
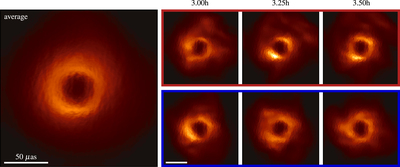
Caption: Figure 26.
Average (left) and snapshot (right) images from the GRMHD simulation used to generate the validation synthetic data set shown in Figure 25. Three frames from the portion of the simulation used to generate the April 10 (top, outlined in red) and April 7 (bottom, outlined in blue) synthetic data sets are shown at the GMST times specified (corresponding to the times indicated by the vertical dotted green lines in Figure 25). All of the images share a common brightness color scale; the absolute brightness scale is arbitrary because each image has been normalized to have unit total flux density, and a modest amount of saturation has been permitted in the brightest regions to enhance the visibility of low-brightness features.
Other Images in This Article


Show More
Copyright and Terms & Conditions
© 2022. The Author(s). Published by the American Astronomical Society.