Image Details
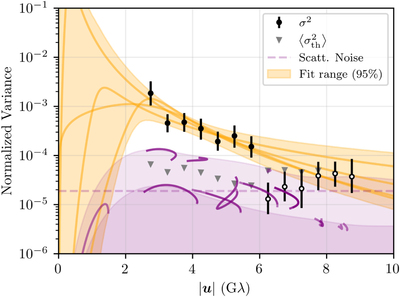
Caption: Figure 4.
Model-agnostic estimate of the azimuthally averaged excess variance of the visibility amplitudes, after subtracting the variance from the reported statistical errors, as a function of baseline length. Nonparametric estimates (filled and open black circles) are obtained across April 5, 6, 7, and 10 and using both high- and low-band data. The filled black circles indicate significant detections of source variability, while the open black circles indicate variance measurements that are dominated by the other sources of uncertainty; only the former are used in the parametric fitting. Uncertainties associated with the thermal errors, uncertain station gains, and polarization leakage are indicated by the error bars. Azimuthally averaged thermal errors are shown by the gray triangles and provide an approximate lower limit on the range of accurate variance estimates. For comparison, the magnitudes of the variance induced by refractive scattering are shown in purple along the minor (top) and major (bottom) axes of the diffractive scattering kernel (see Section 4 of Paper III); the variance along individual tracks on April 7, as well as a ∼10 mJy floor (assuming a fixed 2.5 Jy total flux), is shown by the solid and dashed purple lines, respectively. The orange band indicates the 95th-percentile range of fits to the filled variance estimates shown by filled points by the broken power law of the form in Equation (8), with a handful of specific examples shown explicitly.
Other Images in This Article


Show More
Copyright and Terms & Conditions
© 2022. The Author(s). Published by the American Astronomical Society.