Image Details
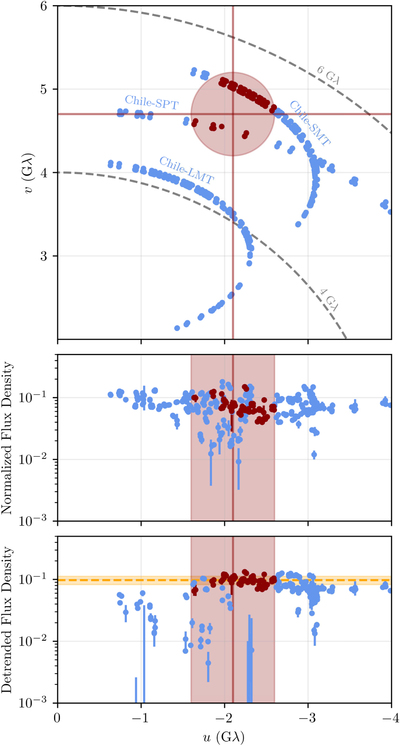
Caption: Figure 3.
Illustration of detrended visibility amplitudes and associated variance estimate. Top: scan-averaged tracks in (u,v)-coordinates with a circular region of diameter 1 Gλ superposed (red disk), centered at ( − 2.1 Gλ, 4.7 Gλ). Scans within the region are dark red, while those outside are blue. Middle: light-curve-normalized visibility amplitudes as a function of u, projected in v (limited to points within the top panel). Bottom: light-curve-normalized visibility amplitudes after detrending with a linear model defined by the scans within the 1 Gλ circular region. The estimated mean and standard deviation are shown by the orange dashed line and horizontal band.
Other Images in This Article


Show More
Copyright and Terms & Conditions
© 2022. The Author(s). Published by the American Astronomical Society.