Image Details
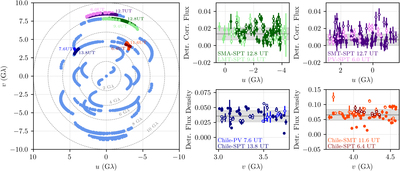
Caption: Figure 2.
Location and detrended visibility amplitudes for crossing and following tracks from the Sgr A* observations on April 5, 6, 7, and 10. Left: the locations of all data points in the (u,v)-plane. Individual baselines correspond to the curving tracks seen in this plot, and we have highlighted the crossing and following tracks using colored points. For reference, circles of constant baseline length are shown by the dashed gray lines. The central time stamps for the highlighted tracks are labeled in the corresponding colors. Right: linearly detrended and light-curve-normalized visibility amplitudes for the crossing and following baselines highlighted in the left panel, shown in corresponding point colors. For crossing tracks (bottom panels), the points within 1 Gλ of the crossing point are shown. Error bars show the thermal errors. For following tracks (top panels) all points for which the baselines overlap are shown. All highlighted points are employed in the linear detrending for each panel. The associated estimates of the mean and standard deviation are shown by the gray dashed line and horizontal band in each panel. The April 7 visibility amplitudes are indicated by open circles.
Other Images in This Article


Show More
Copyright and Terms & Conditions
© 2022. The Author(s). Published by the American Astronomical Society.