Image Details
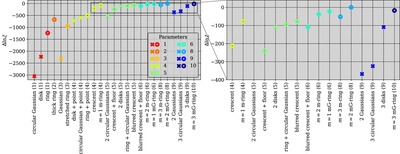
Caption: Figure 6.
Comparison of the relative Bayesian evidence, ﹩{\rm{\Delta }}\mathrm{ln}{ \mathcal Z }﹩, for a series of increasingly complex geometric models fitted using closure amplitudes and closure phases within the snapshot modeling formalism described in detail in Section 6. The fits have been carried out using eht-imaging on the HOPS April 7 Sgr A* data, and each point in the figure is colored according to the number of free parameters in the model; the number of free parameters in each model is also indicated in the horizontal axis labels. The panel on the right shows a zoom-in to the highest-evidence region of the left panel. Ring-like models are indicated with circles, and nonring models are indicated with crosses. All Bayesian evidence values are quoted relative to the highest value attained across all models. The parameter counts reflect the fact that all models are normalized to have unit total flux density and are centered at the image origin. The crescent model consists of a smaller disk subtracted from an offset larger disk. In the crescent+floor model, the smaller disk may have a nonzero flux density. The m-ring and mG-ring models are defined in Section 4.3. The maximum value of ﹩\mathrm{ln}{ \mathcal Z }﹩ among the models explored in this figure is obtained for an m = 2 mG-ring model, in agreement with the DPI analysis described in Section 6.
Other Images in This Article


Show More
Copyright and Terms & Conditions
© 2022. The Author(s). Published by the American Astronomical Society.