Image Details
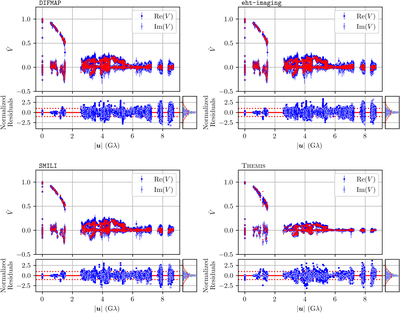
Caption: Figure 9.
Representative examples of imaging results for each of the four imaging pipelines used in Paper III; DIFMAP is shown in the top left panel, eht-imaging in the top right panel, SMILI in the bottom left panel, and THEMIS in the bottom right panel. The top section of each panel shows the light-curve-normalized complex visibility data (in blue) as a function of baseline length; the light-curve-normalized visibilities are denoted as ﹩\hat{V}﹩. The real parts of the complex visibilities are plotted as filled markers, and the imaginary parts of the complex visibilities are plotted as open markers; the corresponding model visibilities are overplotted as red points. The plotted data have been through the pre-analysis and pre-imaging calibration procedures described in M87* Paper III, Paper II, and Paper III. The bottom section of each panel shows the normalized residuals—i.e., the difference between the model and data visibilities, normalized by the data uncertainties—as a function of baseline length. The solid red horizontal line marks zero residual, and the two dotted horizontal red lines mark ± one standard deviation. The blue histogram on the right side of each bottom panel shows the distribution of normalized residuals, with the solid red curve showing a unit-variance normal distribution and the dotted green curve showing a normal distribution with variance equal to that of the normalized residuals. We note that the visibilities for the DIFMAP, eht-imaging, and SMILI pipelines have been “descattered” and so have somewhat larger typical amplitudes than the visibilities for the THEMIS pipeline (for which the scattering is incorporated as part of the forward model; see Equation (5.1) and Paper III). We also note that the different imaging pipelines make different choices about data averaging: DIFMAP and eht-imaging average the data over 60 s intervals, SMILI averages over 120 s intervals, and THEMIS averages over scans. Detailed descriptions of each of the imaging methods are provided in Paper III.
Other Images in This Article


Show More
Copyright and Terms & Conditions
© 2022. The Author(s). Published by the American Astronomical Society.