Image Details
Caption: Figure 25.
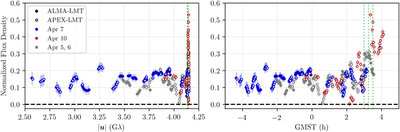
Visibility amplitudes from the HOPS low-band GRMHD validation synthetic data set (data set 092 in Table 7), averaged coherently over 120 s segments, on April 10 (red), April 7 (blue), and April 5 and 10 (gray) on the Chile-LMT baselines as functions of baseline length (left) and observing time (right). Error bars indicate the error implied by the mean noise model and are intended to account for fluctuations due to variability in addition to statistical and known systematic error components. Vertical dotted green lines indicate the positions at which frames are shown in Figure 26.
Other Images in This Article


Show More
Copyright and Terms & Conditions
© 2022. The Author(s). Published by the American Astronomical Society.
Copyright ©
2025 Astronomy Image Explorer. All Rights Reserved.