Image Details
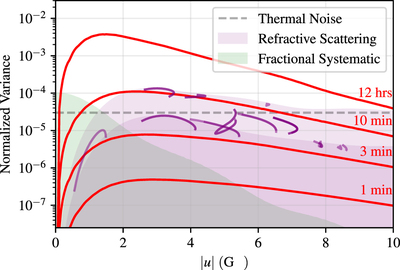
Caption: Figure 1.
The amount of excess variance in the visibility amplitudes expected for a GRMHD simulation (red lines, ﹩{\sigma }_{\mathrm{var}}^{2}﹩), after subtraction of the average image and normalization of the flux density by the light curve. Shown also are the typical thermal noise (black dashed line) and a 1% fractional systematic noise (green band) proportional to the mean image visibility amplitudes. The expected degree of refractive scattering is shown by the purple bands, with purple lines evaluated for a Gaussian source at the projected location of EHT data (see Paper III). The variability is shown about a mean image constructed on different observationally relevant timescales. The fractional systematic and variability noises have been averaged over azimuth and over the position angle of the diffractive screen.
Other Images in This Article


Show More
Copyright and Terms & Conditions
© 2022. The Author(s). Published by the American Astronomical Society.