Image Details
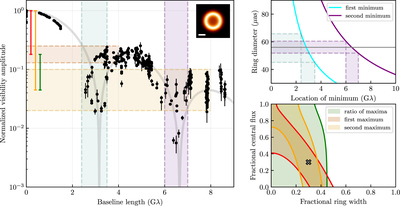
Caption: Figure 7.
An illustration of how the observed visibilities constrain the source structure, within the context of a simple geometric model (see Section 4.2). The left panel shows the debiased visibility amplitudes from April 7 (black points) after normalizing by the light curve, averaging in time across scans, and deconvolving the diffractive scattering kernel. Only data points with a signal-to-noise ratio greater than 3 are shown. The ranges of baseline lengths corresponding to the locations of the first and second visibility minima are highlighted in cyan and purple, respectively. The locations of these minima constrain the diameter of an emitting ring, as shown in the top right panel. Similarly, the ranges of normalized amplitudes corresponding to the first and second visibility maxima are highlighted in red and orange, respectively. Both the absolute fractional amplitudes and their relative values (shown in green) constrain a combination of the fractional ring width and the fractional central flux. The “best-fit” model visibility amplitudes are shown by the gray curve in the left panel, with the corresponding parameters marked by the gray line in the top right panel and the gray cross in the bottom right panel. The image structure corresponding to this model is shown in the upper right corner of the left panel, with a 20 μas scale bar shown in white.
Other Images in This Article


Show More
Copyright and Terms & Conditions
© 2022. The Author(s). Published by the American Astronomical Society.