Image Details
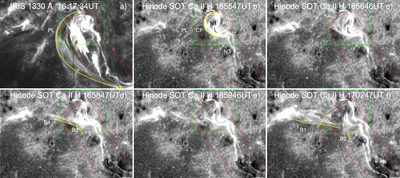
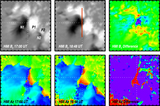
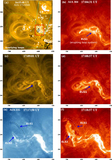
Caption: Figure 6.
Preflare IRIS 1330 Å slit-jaw and Hinode SOT Ca II H images showing the general structure of the flare. The green curves highlight (i) the preexisting loops (PL, panel (a)) thought to be part of the erupted fields, (ii) the expanding core fields (CF, panel (b)) that triggered the chain of events, and (iii) bright erupting fragments B1 and B2, which were also visible in the Hα line (B2, Figure 7, top panel) and the AIA channels (ELS1, Figures 9 and 11). The large red rectangle represents the FOV shown in Figures 7 and 8, while the small green box represents the FOV of Figure 4.
Other Images in This Article
Show More
Copyright and Terms & Conditions
© 2015. The American Astronomical Society. All rights reserved.
Copyright ©
2025 Astronomy Image Explorer. All Rights Reserved.