Image Details
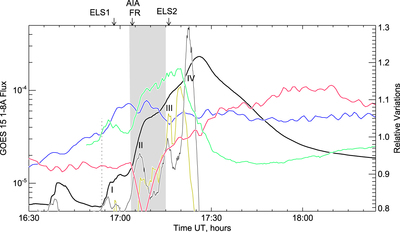
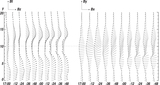
Caption: Figure 1.
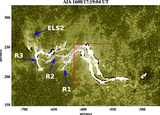
Time variations of normalized positive (blue) and negative (red) magnetic flux measured within the dotted box in Figure 3, Hα – 0.8 Å (green) and AIA 1600 Å (bronze) emission, as well as the GOES X-ray flux (thick black) and its time derivative (thin black). The gray vertical bar denotes the time interval when magnetic flux measurements were affected by the flare emission. The vertical dotted line at 16:54 UT marks the beginning of the sudden rise of the X-ray and the positive magnetic flux. Numbers I through IV mark different stages of the flare, ELS1 and ELS2 indicate moments of eruption of eruptive loop systems (ELS) 1 and 2, while AIA FR indicates the moment when the AIA flux rope (FR) was first detected.
Other Images in This Article
Show More
Copyright and Terms & Conditions
© 2015. The American Astronomical Society. All rights reserved.