Image Details
Caption: Figure 3.
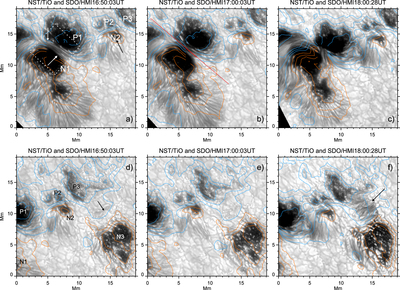
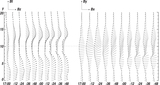
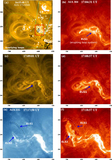
NST/TiO photospheric images overplotted with contours of HMI vertical magnetic fields. Positive (blue) and negative (red) contours are drawn at ±200, ±500, ±800, and ±1100 G levels. The dotted box in panel (a) encloses the area used to monitor magnetic flux variations. Letters N and P mark positive and negative polarity pores discussed in the text, respectively. The HMI data were rotated counterclockwise by 45° to match the orientation of the TiO and Hα images in Figures 7 and 8. The upper panels show evolution of a δ-sunspot, as well as penumbral filaments separating them. The lower panels partially overlap with the top ones (N2, P2, and P3) and show the appearance of an “orphan” penumbra in the photosphere under the filament (black arrows in panels (d) and (f)). The red line segment in panel (b) marks the position of the slit used to analyze the dynamics of the magnetic fields presented in Figure 5.
(An animation of this figure is available.)
The video/animation of this figure is available in the online journal.
Other Images in This Article
Show More
Copyright and Terms & Conditions
© 2015. The American Astronomical Society. All rights reserved.