Image Details
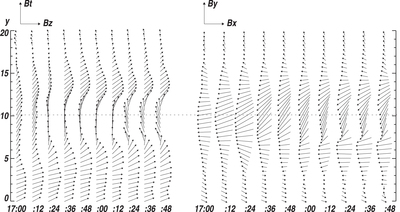
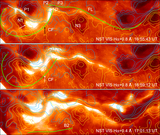
Caption: Figure 5.
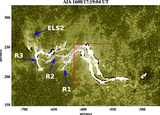
Variations (time–distance arrow plot) of magnetic field inclination (left) and azimuth (right) along the red line segment in Figure 4. The x-axis is parallel to the solar equator and points to the right, the y-axis is parallel to the rotation axis, and the z-axis is in the radial direction. The vertical scales show the length of the slit in arcseconds. The time runs from left to right. In the left Bt–Bz diagram, those arrows pointing to the right of the page represent vertical positive fields. Those arrows pointing to the top of the page (center of the plot) represent horizontal fields. In the right By–Bx diagram, the arrows represent the magnetic field azimuth. The length of an arrow is proportional to the intensity of the Bt component. The longest Bt–Bz arrow represents 1700 G fields, while the longest By–Bx arrow equals 2500 G.
Other Images in This Article
Show More
Copyright and Terms & Conditions
© 2015. The American Astronomical Society. All rights reserved.