Image Details
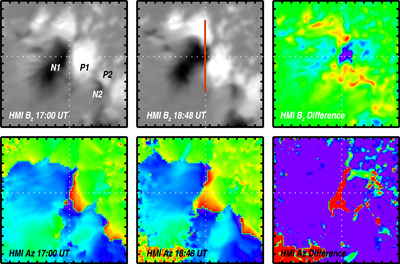
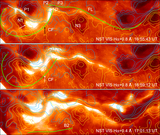
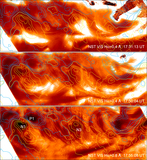
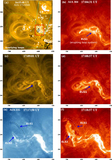
Caption: Figure 4.
Top: HMI Bz magnetograms taken at the flare onset (left, 17:00 UT) and 2 hr after the flare (middle, 18:48 UT) scaled between −1200 G (black) and 1200G (white). The right panel shows their difference, with the dark purple (red) indicating an increase of negative (positive) fields. The two thin dotted lines are plotted to ease comparison between the panels. The red line segment indicates the cut along which the field evolution was plotted in Figure 5. P1, P2, N1, and N2 indicate the same sunspots as in Figure 3. Bottom: HMI magnetic field azimuth maps taken at 17:00 UT and 18:48 UT (left and middle) scaled between 0° (dark blue) and 360° (dark red). The right panel shows their difference, with the purple area indicating azimuthal changes less then 15° and red areas representing the changes exceeding 90°.
Other Images in This Article
Show More
Copyright and Terms & Conditions
© 2015. The American Astronomical Society. All rights reserved.