Image Details
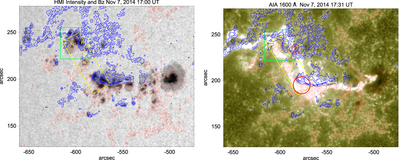
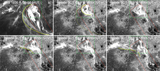
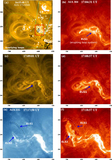
Caption: Figure 2.
SDO/HMI Bz magnetogram plotted over the HMI intensity map (left) and an SDO/AIA 1600 Å image taken after the peak of the X1.6 class flare (right). In both images the positive (blue) and negative (red) contours are drawn at ±200, ±500, ±800, and ±1100 G levels. The red circle represent RHESSI 12–25 keV emission drawn at the ≈50% level of the peak intensity. The yellow box outlines the FOV of the NST Hα images shown in Figures 7 and 8. The green box indicates the FOV shown in Figures 3 and 4. The images were not corrected for the projection effect.
Other Images in This Article
Show More
Copyright and Terms & Conditions
© 2015. The American Astronomical Society. All rights reserved.
Copyright ©
2025 Astronomy Image Explorer. All Rights Reserved.