Image Details
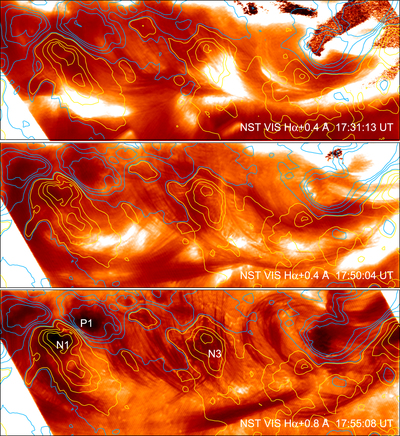
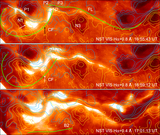
Caption: Figure 8.
NST/VIS Hα – 0.8 Å images of the X1.6 flare on 2014 November 7 during the peak of the flare (17:31 UT) and the formation of the PEA. The blue/yellow contours represent co-temporal HMI vertical positive/negative fields plotted at ±50, ±500, ±800, and ±1100 G. The black and gray patches inside the flare ribbons (bottom panel) are due to saturation of the detector. The FOV is 22″ × 8″. The images were not corrected for the projection effect.
(An animation of this figure is available.)
The video/animation of this figure is available in the online journal.
Other Images in This Article
Show More
Copyright and Terms & Conditions
© 2015. The American Astronomical Society. All rights reserved.
Copyright ©
2025 Astronomy Image Explorer. All Rights Reserved.