1456 images found
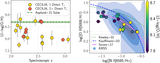
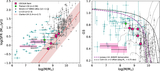
Left: direct gas-phase O/H vs. z measured in 19...
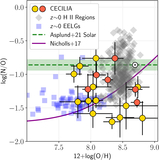
The N/O–O/H abundance trends in the CECILIA gal...
Emission in the spatial direction of the 2D NIR...
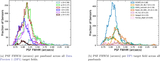
Comparisons of Stokes I, linear polarization, a...
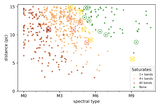
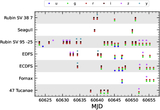
The POKEMON catalog as a function of spectral t...
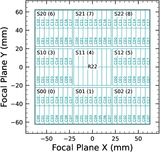
LSSTComCam focal plane layout, showing R22 and ...
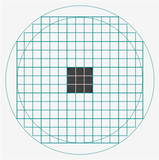
LSSTComCam focal plane layout illustrating the ...
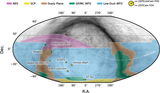
Locations of the seven DP1 fields overlaid on t...
Temporal distribution of DP1 observations, grou...
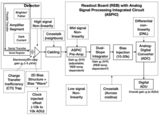
The model of the detector and REB components, l...
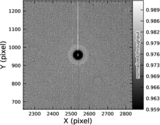
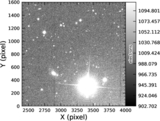
A large vampire pixel near the center of R22_S1...
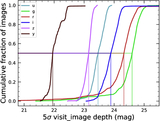
Normalized cumulative histograms of the 5σ dept...
Histograms showing the distribution of delivere...
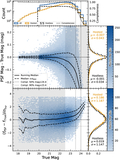
Magnitude residuals and flux pulls for i-band P...
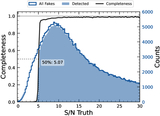
The difference image detection completeness for...
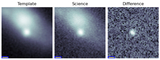
An example an image triplet consisting of cutou...
An example of a bright star with oversubtracted...
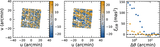
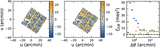
Visualization of DCR observed in the LSSTComCam...
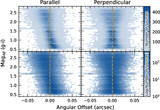
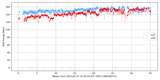
Astrometric residuals in the u (left panel) and...
Astrometric residuals in the u (left panel) and...
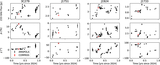
Left: Hα-based SFRs vs. stellar mass for our CE...
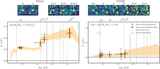
Photometry and best-fit SED models for two sour...
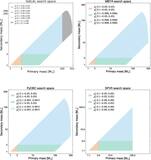
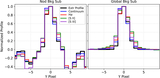
Regions of the CBC parameter space explored by ...
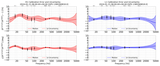
LIGO Hanford (left) and Livingston (right) freq...
ANNOUNCEMENTS
Take the AstroExplorer for a spin!
Be sure to try the search and sorting features, which were added based on user feedback; browse and find the links to videos and interactive figures in our Journal articles; find AAS Research Notes; or notice that new publishers have begun adding their figures to the AIE. Get in touch to hear more!