

Image Details
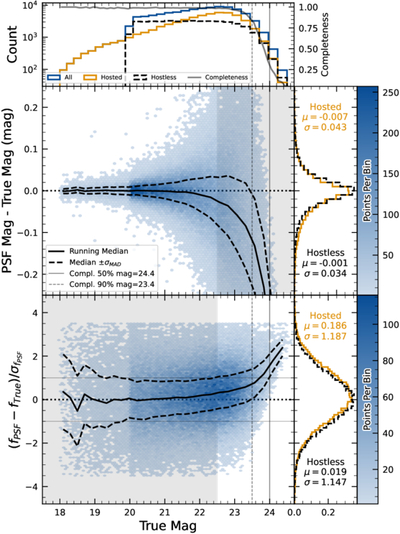
Caption: Figure 39.
Magnitude residuals and flux pulls for i-band PSF photometry on difference images for the ECDFS field in i for detected injected sources. Top panel: distribution of true magnitudes for injected sources (blue), and split into hostless (black dash) and hosted (orange) sources, with detection completeness as a function of true magnitude (gray line). Vertical dashed lines indicate the 90% and 50% completeness magnitude limits. Center left panel: two-dimensional hexbin plot of PSF magnitude residuals (measured minus true) vs. true magnitude for detected sources, with the running median (solid black) and σMAD (dashed black) overlaid. Center right panel: marginalized distributions of PSF magnitude residuals for hostless (blue) and hosted (orange) sources with true magnitude mi < 22.5, annotated with the robust mean and standard deviation. Bottom left panel: two-dimensional hexbin plot of PSF flux pulls vs. true magnitude for detected sources, with the running median (solid black) and σMAD (dashed black) overlaid. Bottom right panel: marginalized distributions of PSF flux pulls for hostless (blue) and hosted (orange) sources with true magnitude mi < 22.5, annotated with the robust mean and standard deviation.
Other Images in This Article

Show More
Copyright and Terms & Conditions
© 2026. The Author(s). Published by the American Astronomical Society.

