Image Details
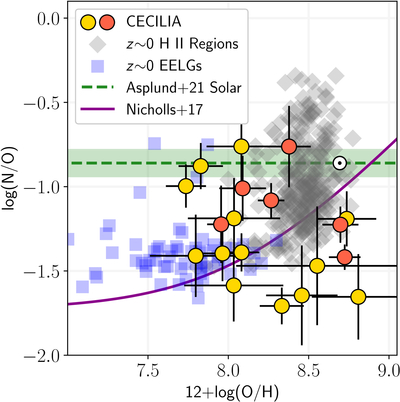
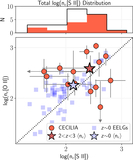
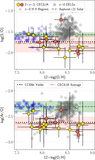
Caption: Figure 10.
The N/O–O/H abundance trends in the CECILIA galaxies, local star-forming nebulae (gray diamonds and blue squares), Galactic stars (solid purple line, from D. C. Nicholls et al. 2017), and the Sun (green dashed line and circled dot, from M. Asplund et al. 2021). The color of the CECILIA galaxies represents the number of direct Te measurements; see Figure 6. The CECILIA galaxies generally scatter around the primary plateau at log(N/O) ∼ −1.45 dex and the secondary N/O locus observed in metal-rich H II regions. The low N/O at 12 + log(O/H) > 8.5 dex in some CECILIA galaxies could be a signature of high SFE. High N/O at 12 + log(O/H) < 8.0 has been reported in other high-z galaxies and is observed in a portion of the CECILIA sample, but it is infrequently observed at z ∼ 0.
Other Images in This Article
Show More
Copyright and Terms & Conditions
© 2026. The Author(s). Published by the American Astronomical Society.