Image Details
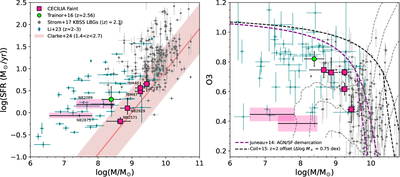
Caption: Figure 2.
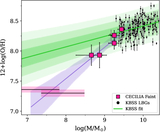
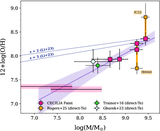
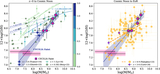
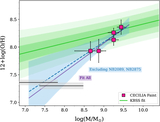
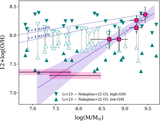
Left: Hα-based SFRs vs. stellar mass for our CECILIA Faint sample (pink squares and shaded rectangles), derived using a metallicity-dependent SFR conversion. The two CECILIA Faint galaxies without continuum detections are shown as shaded pink bands indicating their 68% probability ranges of possible masses along with the best estimates of their SFRs and associated uncertainties (see Section 3.1). For consistency, we recalculate the SFRs of the z ∼ 2.56 stack from R. F. Trainor et al. (2016, green circle) and the KBSS LBGs (A. L. Strom et al. 2017; gray circles) using the same method. For comparison, we also show the Hα-based SFR–M⋆ relation for 1.4 < z < 2.7 galaxies from L. Clarke et al. (2024), as well as individual lensed dwarf galaxies at z ∼ 2–3 selected as [O III] emitters in JWST/NIRISS spectroscopy by M. Li et al. (2023, teal diamonds). We generally find consistency between the CECILIA Faint sources and these comparison samples in the SFR–M* plane. Right: the MEx diagram for the CECILIA Faint galaxies and the same comparison samples as in the left panel. The gray dashed contours represent SDSS z ∼ 0 galaxies. We include the original S. Juneau et al. (2014) star-forming/AGN boundaries (purple dashed) and the redshift-adjusted versions shifted by ﹩{\rm{\Delta }}\mathrm{log}{M}_{* }=0.75﹩ dex from A. L. Coil et al. (2015), appropriate for z ∼ 2 galaxies. The CECILIA Faint galaxies broadly agree with the M. Li et al. (2023) sample at M* > 108 M⊙, but have significantly lower O3 ratios at lower masses.
Other Images in This Article
Copyright and Terms & Conditions
© 2026. The Author(s). Published by the American Astronomical Society.