Image Details
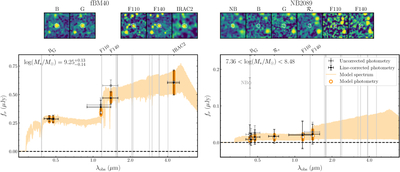
Caption: Figure 1.
Photometry and best-fit SED models for two sources in the CECILIA Faint sample. The upper panels show the images and isophotal apertures used for photometry for each band. Note that the IRAC2 photometry is measured using a PSF-based procedure as described in Section 2.2. In the lower panels, gray points show the original photometric measurements of each source, while black points show the result of subtracting the measured or inferred emission-line fluxes as described in Section 3.1. Vertical gray lines denote the wavelengths of these emission lines, and horizontal error bars denote the approximate bandpass of each filter. fBM40 (left) is one of the more massive objects and has secure photometric detections in five bands. Conversely, NB2089 (right) is an example of an object that is only weakly detected in the continuum bands, particularly after subtracting the inferred emission-line contributions. Note that the Lyα narrowband (NB) detection of NB2089 and line-corrected flux are displayed for comparison to the continuum fluxes, although the NB band is excluded during the SED fitting. No narrowband photometry is shown for fBM40 since the wavelength of the narrowband filter does not cover Lyα at the redshift of this galaxy, and ﹩{{ \mathcal R }}_{s}﹩ is also excluded for this galaxy due to an image defect that contaminated the photometry for this object. The IRAC2 photometry for NB2089 is excluded due to contamination from nearby brighter sources.
Other Images in This Article
Copyright and Terms & Conditions
© 2026. The Author(s). Published by the American Astronomical Society.